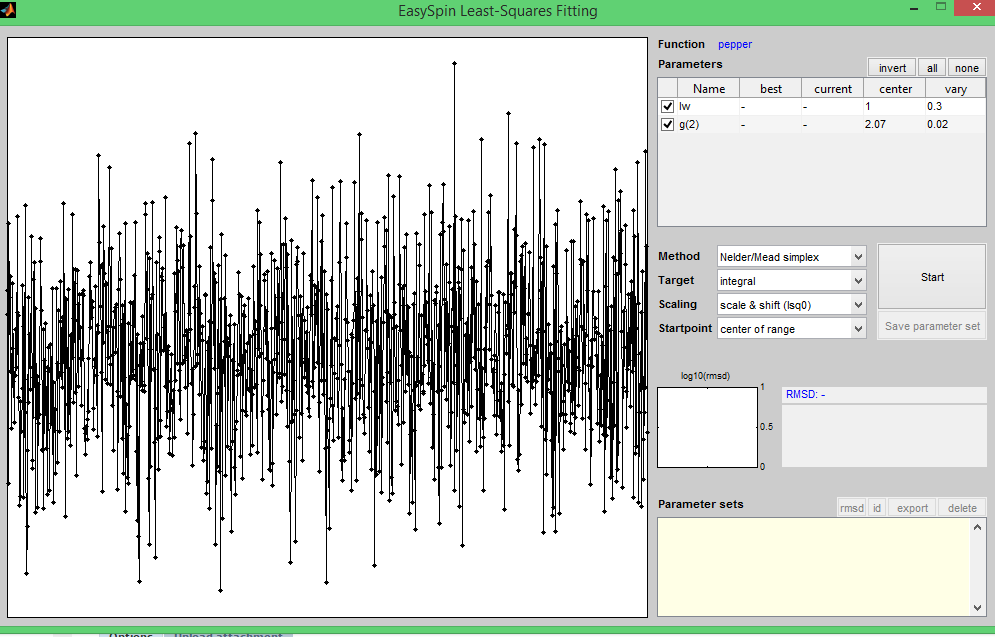
Hi! everyone. I'm trying to fit my experimental result from EPR spectrometer by EasySpin on MatLab. My spectra file were saved in form .DTA and .DSC. So, I wrote MaTLab for analysis this following by the code
Code: Select all
clear
[spc,Params,B] = eprload('1KGY1OCT2016.DSC');
spc = addnoise(spc,0.0000000000000000000000000000000000001,'n');
Sys0.g = [1.99, 2.07, 2.11];
Sys0.lw = 1;
Vary.lw = 0.3;
Vary.g = [0 0.02 0];
Vary.lw = 0.3;
Exp.mwFreq = 9.8;
Exp.Range = [200 400];
esfit('pepper',spc,Sys0,Vary,Exp);
The code was typed from Fitting EPR spectra section in website Easyspin
http://easyspin.org/documentation/userg ... tting.html. The result from running the code shows as file 11.png.

- My fitting pannel
- 11.png (80.58 KiB) Viewed 4122 times
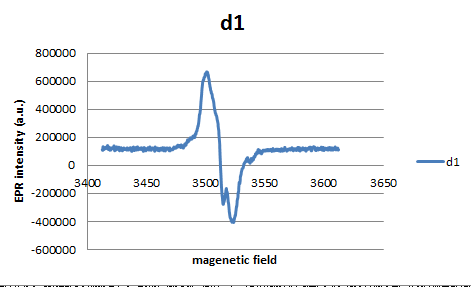
I don't know why it is and think there is some mistakes which occurred in my EPR spectrum or I missed something (may be I have to do noise reduction of the spectrum before insert to fitting code ) in the code. I think if I write the good code, I will get the exact spectrum like this

- The real spectrum (horizontal axis has "G" unit).
- 12.png (10.29 KiB) Viewed 4122 times
.
Moreover, I have also attached my ERP spectrum file as from .DTA and .DSC.
.DTA :
https://drive.google.com/file/d/0B3uZI4 ... sp=sharing and .DSC :
https://drive.google.com/file/d/0B3uZI4 ... sp=sharing
Thank you for all suggestions.