Page 1 of 2
Hyperfinesplitting drawing program
Posted: Thu Mar 01, 2018 3:28 am
by moreutz
Hello,
I would like to draw diefferent splitting schemes like in the picture (
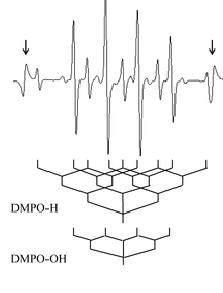
- Splitting scheme DMPO.PNG (26.96 KiB) Viewed 4203 times
).
Does anyone know a program to create them?
Best regards
moreutz
Re: Hyperfinesplitting drawing program
Posted: Thu Mar 01, 2018 4:35 am
by katarkon
You may try this script. Just change the spin system as You want.
Code: Select all
clear, clf
Sys.g = 2;
Sys.Nucs = '14N,1H,1H';
Sys.lw = [0,0.02];
Sys.A = [10; 5; 2]; % MHz
Sys.n=[2 1 4];
Exp.Range=[343 347];
Exp.mwFreq = 9.65;
Exp.nPoints=4096;
Exp1=Exp;
Exp1.Harmonic=0;
Opt.Method='perturb1';
nspin=numel(Sys.A);
for i=0:nspin
    if i>0
        Sys1=nucspinkeep(Sys,1:i);
    else
        Sys1=nucspinrmv(Sys,1:nspin);
    end
    Sys1=rmfield(Sys1,'lw');
    yy=garlic(Sys1,Exp1,Opt);
    yy=yy/max(yy);
    y(:,i+1)=yy;
end
[x,yy]=garlic(Sys,Exp,Opt);
yy=yy/max(yy);
y(:,nspin+2)=yy;
stackplot(x,y,1,1.1);
Re: Hyperfinesplitting drawing program
Posted: Fri Mar 02, 2018 5:29 am
by katarkon
This script draws splitting scheme as on the picture. Just define required spin system and correct field range. Equivalent nuclei and isotope mixtores does not supported yet.
Code: Select all
clear, clf

% Parameters
%--------------------------------------------------------------------------
% Spin system
Sys.g=gfree;
Sys.Nucs='14N,14N,1H';
Sys.A=[10 12 5];
Sys.lwpp = [0,0.02]; % Lorentzian lines

Exp.CenterSweep = [339.4, 2];
Exp.nPoints = 4096;
Exp.mwFreq=1e-3*mt2mhz(Exp.CenterSweep(1),mean(Sys.g));
% Simulations
%--------------------------------------------------------------------------

[xa,ya] = garlic(Sys,Exp);

% Diagram calculation
%--------------------------------------------------------------------------
if isfield(Exp,'Range'), dx=1/mt2mhz(max(Exp.Range)-min(Exp.Range),mean(Sys.g));end
if isfield(Exp,'CenterSweep'), dx=1/mt2mhz(Exp.CenterSweep(2),mean(Sys.g));end
nNucGroups=0;
if ~isempty(Sys.Nucs)
  I = nucspin(Sys.Nucs);
  nNucGroups = max(size(Sys.A));
  dy=1/(1+3*nNucGroups);
  if numel(I)~=nNucGroups, error('Sys.A and Sys.Nucs are not consistent.'); end
end
set(gcf,'Color','w');
axes('Position', [0 0 1 1]);
plot(xa,ya,'k');
axis off;
axis([min(xa) max(xa) min(ya)*(1+2*nNucGroups) max(ya)]);
y=0;
x=[0.5];
annotation ('line',[x x],[y dy]); %first line
y=y+dy;
for i=1:nNucGroups
    mI = -I(i):I(i);
    x2=[];
    for j=1:numel(x)
        x1=x(j)+dx*Sys.A(i)*mI;
        for k=1:numel(x1)
            annotation ('line',[x(j) x1(k)],[y y+dy],'LineStyle',':'); %splitting line
            annotation ('line',[x1(k) x1(k)],[y+dy y+2*dy]); %next line
        end
       x2=[x2 x1];
    end
    x=x2;
    y=y+2*dy;
end
Re: Hyperfinesplitting drawing program
Posted: Fri Mar 02, 2018 10:27 am
by Stefan Stoll
Nice!
Re: Hyperfinesplitting drawing program
Posted: Mon Mar 05, 2018 1:37 am
by katarkon
The support for equivalent nuclei is added.
Code: Select all
clear, clf

% Parameters
%--------------------------------------------------------------------------
% Spin system
Sys.g=gfree;
Sys.Nucs='14N,1H';
Sys.A=[10 0.6];
Sys.n=[2 12];
Sys.lwpp = [0,0.02]; % Lorentzian lines

Exp.CenterSweep = [339.4, 2];
Exp.nPoints = 4096;
Exp.mwFreq=1e-3*mt2mhz(Exp.CenterSweep(1),mean(Sys.g));
% Simulations
%--------------------------------------------------------------------------

[xa,ya] = garlic(Sys,Exp);

% Diagram calculation
%--------------------------------------------------------------------------
if isfield(Exp,'Range'), dx=1/mt2mhz(max(Exp.Range)-min(Exp.Range),mean(Sys.g));end
if isfield(Exp,'CenterSweep'), dx=1/mt2mhz(Exp.CenterSweep(2),mean(Sys.g));end
nNucGroups=0;
if ~isempty(Sys.Nucs)
  I = nucspin(Sys.Nucs);
  nNucGroups = max(size(Sys.A));
  dy=1/(1+3*nNucGroups);
  if numel(I)~=nNucGroups, error('Sys.A and Sys.Nucs are not consistent.'); end
  if isfield(Sys,'n')&&max(Sys.n)>1 %equiv nucs
      for i=1:numel(Sys.n)
          if Sys.n(i)>1
              [I1,~]=equivcouple(I(i),Sys.n(i));
              I(i)=I1(1);
          end
      end
  end
end
set(gcf,'Color','w');
axes('Position', [0 0 1 1]);
plot(xa,ya,'k');
axis off;
axis([min(xa) max(xa) min(ya)*(2.5+2*nNucGroups) max(ya)]);
y=0;
x=[0.5];
annotation ('line',[x x],[y dy]); %first line
y=y+dy;
for i=1:nNucGroups
    mI = -I(i):I(i);
    x2=[];
    for j=1:numel(x)
        x1=x(j)+dx*Sys.A(i)*mI;
        for k=1:numel(x1)
            annotation ('line',[x(j) x1(k)],[y y+dy],'LineStyle',':'); %splitting line
            annotation ('line',[x1(k) x1(k)],[y+dy y+2*dy]); %next line
        end
       x2=[x2 x1];
    end
    x=x2;
    y=y+2*dy;
end
Re: Hyperfinesplitting drawing program
Posted: Tue Mar 06, 2018 3:10 am
by moreutz
Thank you very much!
Unfortunately I have an natural isoptope mixture (Sys.Nucs = 'N,H')..
Re: Hyperfinesplitting drawing program
Posted: Tue Mar 06, 2018 8:29 am
by Matt Krzyaniak
moreutz wrote:Thank you very much!
Unfortunately I have an natural isoptope mixture (Sys.Nucs = 'N,H')..
For both N and H you generally don't need to worry about natural isotope mixtures, as their isotope abundances <<1%.
Re: Hyperfinesplitting drawing program
Posted: Wed Mar 07, 2018 5:08 am
by moreutz
This is my input:
Code: Select all
Sys.A = mt2mhz([1.49 1.49]);
Sys.g = 2.005;
Sys.lwpp = [0 0.12];
Sys.Nucs = '14N,1H';
Sys.n= [1 1];

Exp.mwFreq = 9.44;
Exp.nPoints = 4096;
Exp.Range = [331 342]
So I get this diagram:

- Aufspaltungsmuster DMPO-OH.jpg (30.73 KiB) Viewed 4127 times
Why isn't it correct?
Re: Hyperfinesplitting drawing program
Posted: Wed Mar 07, 2018 10:37 am
by katarkon
The diagram starts drawing from the center of the figure. The spectrum have to be centered too. It may be forced by either Exp.mwFreq=1e-3*mt2mhz(Exp.CenterSweep(1),mean(Sys.g)); or Exp.mwFreq=1e-3*mt2mhz(mean(Exp.Range),mean(Sys.g)); depending how You prefer define the field range.
Sorry, this is indeed unclear moment.
Re: Hyperfinesplitting drawing program
Posted: Thu Mar 08, 2018 1:15 am
by moreutz
Perfect, thanks a lot!
